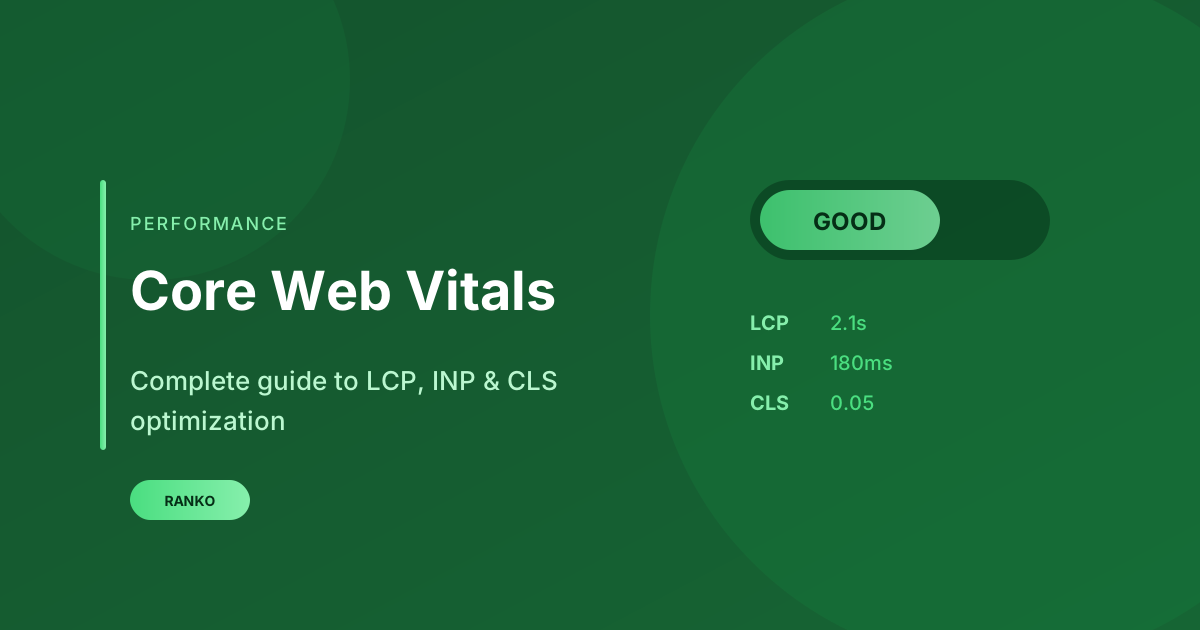
The uncomfortable truth about Core Web Vitals
Let me be honest with you: Core Web Vitals matter, but probably not as much as you think. I've seen sites with terrible CWV scores rank #1, and sites with perfect green scores struggle on page 2.
That said, if you're in a competitive niche and your CWV scores are significantly worse than your competitors, you're leaving ranking potential on the table. And beyond SEO, slow sites genuinely hurt conversions — I've measured this across dozens of client sites.
This guide is what I wish I had when I started optimizing for CWV. No fluff, no "hire a developer" cop-outs. Just practical fixes you can actually implement.
Understanding the three Core Web Vitals
Google measures three specific things. Each one matters for a different reason:
LCP (Largest Contentful Paint)
What it measures: How long until the biggest element on your page is visible. Usually your hero image, hero text, or main content block.
Target: Under 2.5 seconds (ideally under 2.0s)
Why it matters: This is what users perceive as "the page loaded." If your LCP is slow, users feel like your site is slow — even if everything else is fast.
Common culprits: Unoptimized hero images, slow server response (TTFB), render-blocking CSS/JS, web fonts loading slowly.
INP (Interaction to Next Paint)
What it measures: How long until the page responds when a user clicks, taps, or presses a key. This replaced FID (First Input Delay) in March 2024.
Target: Under 200 milliseconds
Why it matters: Users expect instant feedback. When they click a button and nothing happens for 500ms, it feels broken.
Common culprits: Heavy JavaScript execution, third-party scripts (analytics, ads, chat widgets), complex event handlers.
CLS (Cumulative Layout Shift)
What it measures: How much stuff moves around after the page loads. Those annoying moments when you're about to click something and it jumps.
Target: Under 0.1
Why it matters: Layout shifts are incredibly frustrating. Users click the wrong thing, lose their place while reading, and generally have a bad time.
Common culprits: Images without dimensions, ads loading late, web fonts causing text reflow, dynamically injected content.
How to diagnose your Core Web Vitals issues
Before you start fixing things, you need to know what's actually broken. Here's how I approach CWV audits:
Step 1: Check your field data in Search Console
Go to Search Console → Core Web Vitals. This shows real user data, which is what Google actually uses for rankings. Lab tools like Lighthouse are useful for debugging, but field data is the truth.
If you don't have enough traffic for field data, you'll need to rely on lab testing and hope it correlates with real users.
Step 2: Identify your worst pages
Search Console groups URLs by similar patterns. Click into each failing group to see which specific pages have problems. Usually it's not your whole site — it's specific templates or page types.
Step 3: Run PageSpeed Insights on failing pages
For each failing page, run it through PageSpeed Insights. The "Diagnostics" section tells you exactly what's causing each issue. Make a list.
Step 4: Prioritize by impact
Not all fixes are equal. A change that improves LCP by 500ms on your homepage matters more than fixing CLS on a page that gets 10 visits per month. Prioritize:
- High-traffic pages first
- Pages that rank but could rank better
- Easy wins (low effort, high impact)
Fixing LCP: Make your page load faster
LCP is usually the hardest to fix because it involves multiple systems. Here's my priority order:
1. Optimize your LCP element
First, figure out what your LCP element actually is. In PageSpeed Insights, it tells you. Common LCP elements:
- Hero image: Compress it, use modern formats (WebP/AVIF), and most importantly — preload it
- Hero text: Make sure your fonts load fast (more on this below)
- Background image in CSS: Convert to an <img> tag so you can preload it
2. Add preload hints for critical resources
<!-- Preload hero image -->
<link rel="preload" as="image" href="/hero.webp" fetchpriority="high">

<!-- Preload critical font -->
<link rel="preload" as="font" href="/fonts/main.woff2"
      type="font/woff2" crossorigin>
Warning: Don't preload everything. Only preload above-the-fold resources. Over-preloading actually makes things worse.
3. Fix your server response time (TTFB)
If your Time to First Byte is over 600ms, no amount of front-end optimization will save you. Common fixes:
- Enable server-side caching (Redis, Varnish, or your CMS's built-in cache)
- Use a CDN (Cloudflare is free and effective)
- Optimize database queries (often the real culprit)
- Upgrade your hosting if needed (shared hosting is usually too slow)
4. Eliminate render-blocking resources
CSS and JavaScript in your <head> block rendering until they load. Solutions:
- Critical CSS: Inline your above-the-fold CSS, load the rest async
- JavaScript: Add
deferorasyncto script tags - Third-party scripts: Load them after page load when possible
5. Optimize images properly
I see this wrong so often. Here's the actual best practice:
<img
  src="image.webp"
  srcset="image-400.webp 400w, image-800.webp 800w, image-1200.webp 1200w"
  sizes="(max-width: 600px) 400px, (max-width: 1000px) 800px, 1200px"
  width="1200"
  height="630"
  loading="lazy"
  decoding="async"
  alt="Descriptive alt text"
>
For LCP images specifically: Don't use loading="lazy" and add fetchpriority="high".
Fixing INP: Make your page respond faster
INP is the newest metric and often the trickiest. It's about JavaScript performance and how quickly your page responds to user interactions.
1. Identify slow interactions
Use Chrome DevTools → Performance tab. Record yourself clicking around your site. Look for "Long Tasks" (anything over 50ms blocks the main thread).
2. Break up long JavaScript tasks
If you have JavaScript that takes 200ms to run, the browser can't respond to clicks during that time. Solution: break it into smaller chunks using requestIdleCallback or setTimeout:
// Instead of one long task:
processAllItems(items);

// Break it up:
function processInChunks(items, chunkSize = 10) {
  let index = 0;
  function processChunk() {
    const chunk = items.slice(index, index + chunkSize);
    chunk.forEach(processItem);
    index += chunkSize;
    if (index < items.length) {
      setTimeout(processChunk, 0); // Yield to the browser
    }
  }
  processChunk();
}
3. Audit third-party scripts
Third-party scripts are the #1 cause of INP issues I see. Check what's running:
- Analytics scripts (especially if you have multiple)
- Chat widgets (often add 500ms+ to interactions)
- Social media embeds
- A/B testing tools
- Tag managers with lots of tags
Either remove what you don't need or load them after user interaction (e.g., load chat widget when user scrolls).
4. Optimize event handlers
If clicking a button triggers a lot of work, debounce it or do the heavy work asynchronously:
button.addEventListener('click', async () => {
  // Show immediate feedback
  button.textContent = 'Loading...';

  // Do heavy work in next frame
  await new Promise(r => requestAnimationFrame(r));

  // Now do the actual work
  await doExpensiveOperation();
});
Fixing CLS: Stop layout shifts
CLS is usually the easiest to fix once you know what's causing it.
1. Always set dimensions on images and videos
<!-- Good: browser reserves space -->
<img src="photo.jpg" width="800" height="600" alt="...">

<!-- Or use aspect-ratio in CSS -->
<img src="photo.jpg" style="aspect-ratio: 4/3; width: 100%;" alt="...">
2. Reserve space for ads
If you run ads, they're probably your biggest CLS source. Use min-height on ad containers:
.ad-slot {
  min-height: 250px; /* Match your ad unit size */
  background: #f0f0f0; /* Optional placeholder */
}
3. Fix font loading
When custom fonts load, text can resize and shift. Use font-display: swap and match your fallback font metrics:
@font-face {
  font-family: 'CustomFont';
  src: url('/fonts/custom.woff2') format('woff2');
  font-display: swap;
  /* These reduce shift by matching fallback font size */
  size-adjust: 105%;
  ascent-override: 95%;
}
4. Don't inject content above existing content
Cookie banners, notification bars, "you might also like" widgets — if they appear above existing content after load, they cause CLS. Solutions:
- Reserve space for them in your initial HTML
- Load them below the fold
- Use overlays instead of pushing content
5. Use CSS transforms for animations
If you're animating positions, use transform instead of top/left/margin. Transforms don't cause layout shifts:
/* Bad - causes layout shift */
.slide-in {
  animation: slideInBad 0.3s;
}
@keyframes slideInBad {
  from { margin-left: -100px; }
  to { margin-left: 0; }
}

/* Good - no layout shift */
.slide-in {
  animation: slideInGood 0.3s;
}
@keyframes slideInGood {
  from { transform: translateX(-100px); }
  to { transform: translateX(0); }
}
Monitoring and maintaining good CWV
CWV can degrade over time as you add features, new scripts, and more content. Set up monitoring:
Search Console
Check weekly. Set a calendar reminder. Google shows you trends over time.
Real User Monitoring (RUM)
If you're serious, add real user monitoring. Options:
- Free: web-vitals JavaScript library + send to your analytics
- Paid: SpeedCurve, Calibre, or similar
import {onCLS, onINP, onLCP} from 'web-vitals';

function sendToAnalytics(metric) {
  // Send to your analytics
  gtag('event', metric.name, {
    value: Math.round(metric.value),
    event_label: metric.id,
  });
}

onCLS(sendToAnalytics);
onINP(sendToAnalytics);
onLCP(sendToAnalytics);
Pre-deployment testing
Run Lighthouse in CI/CD. Fail the build if CWV regresses beyond a threshold. This catches problems before they hit production.
The bottom line
Core Web Vitals optimization is a marathon, not a sprint. Focus on the biggest issues first, measure the impact, and iterate. And remember: a fast, responsive site isn't just about SEO — it's about not annoying your users. That alone is worth the effort.
Start with your highest-traffic pages, fix LCP first (usually the biggest issue), then tackle INP and CLS. You'll see improvements in Search Console within 28 days of fixes going live.